Precipitation
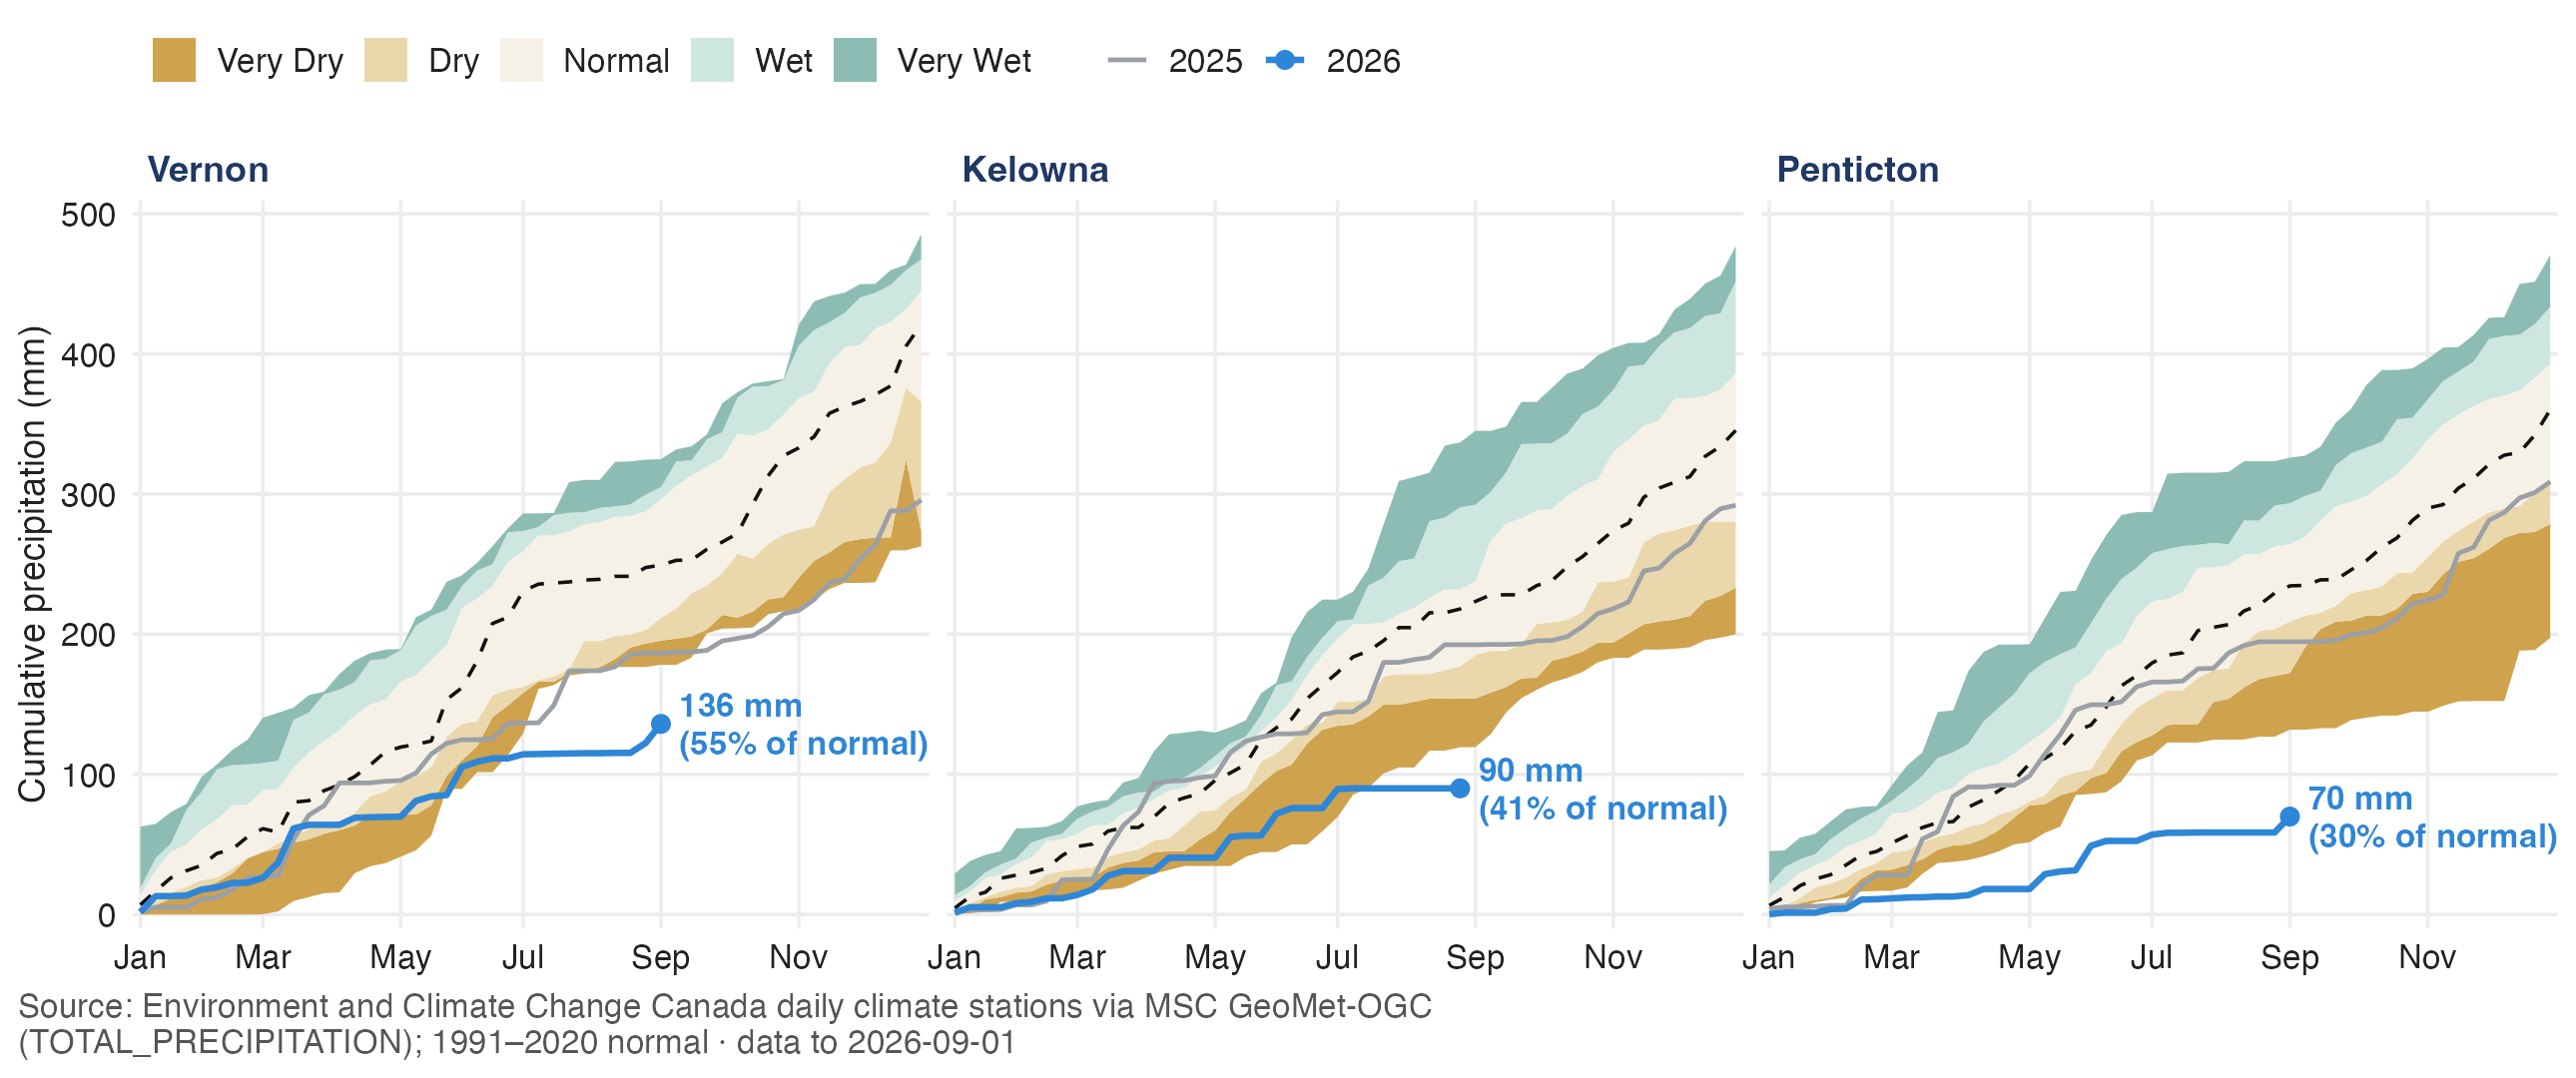
Updated 2026-09-01 · 3 days agoPrecipitation deficits remain pronounced across the Okanagan. Cumulative precipitation through September 1 was approximately 136 mm in Vernon, 90 mm in Kelowna and 70 mm in Penticton, representing about 50%, 41% and 30% of normal, respectively. The deficit gets worse from north to south and has persisted through the spring and summer, with relatively little precipitation available to offset water use or replenish surface-water and groundwater supplies. The prolonged precipitation deficit is an important underlying driver of the low streamflows, declining lake levels and groundwater stress now being observed throughout the basin.
Stream flows
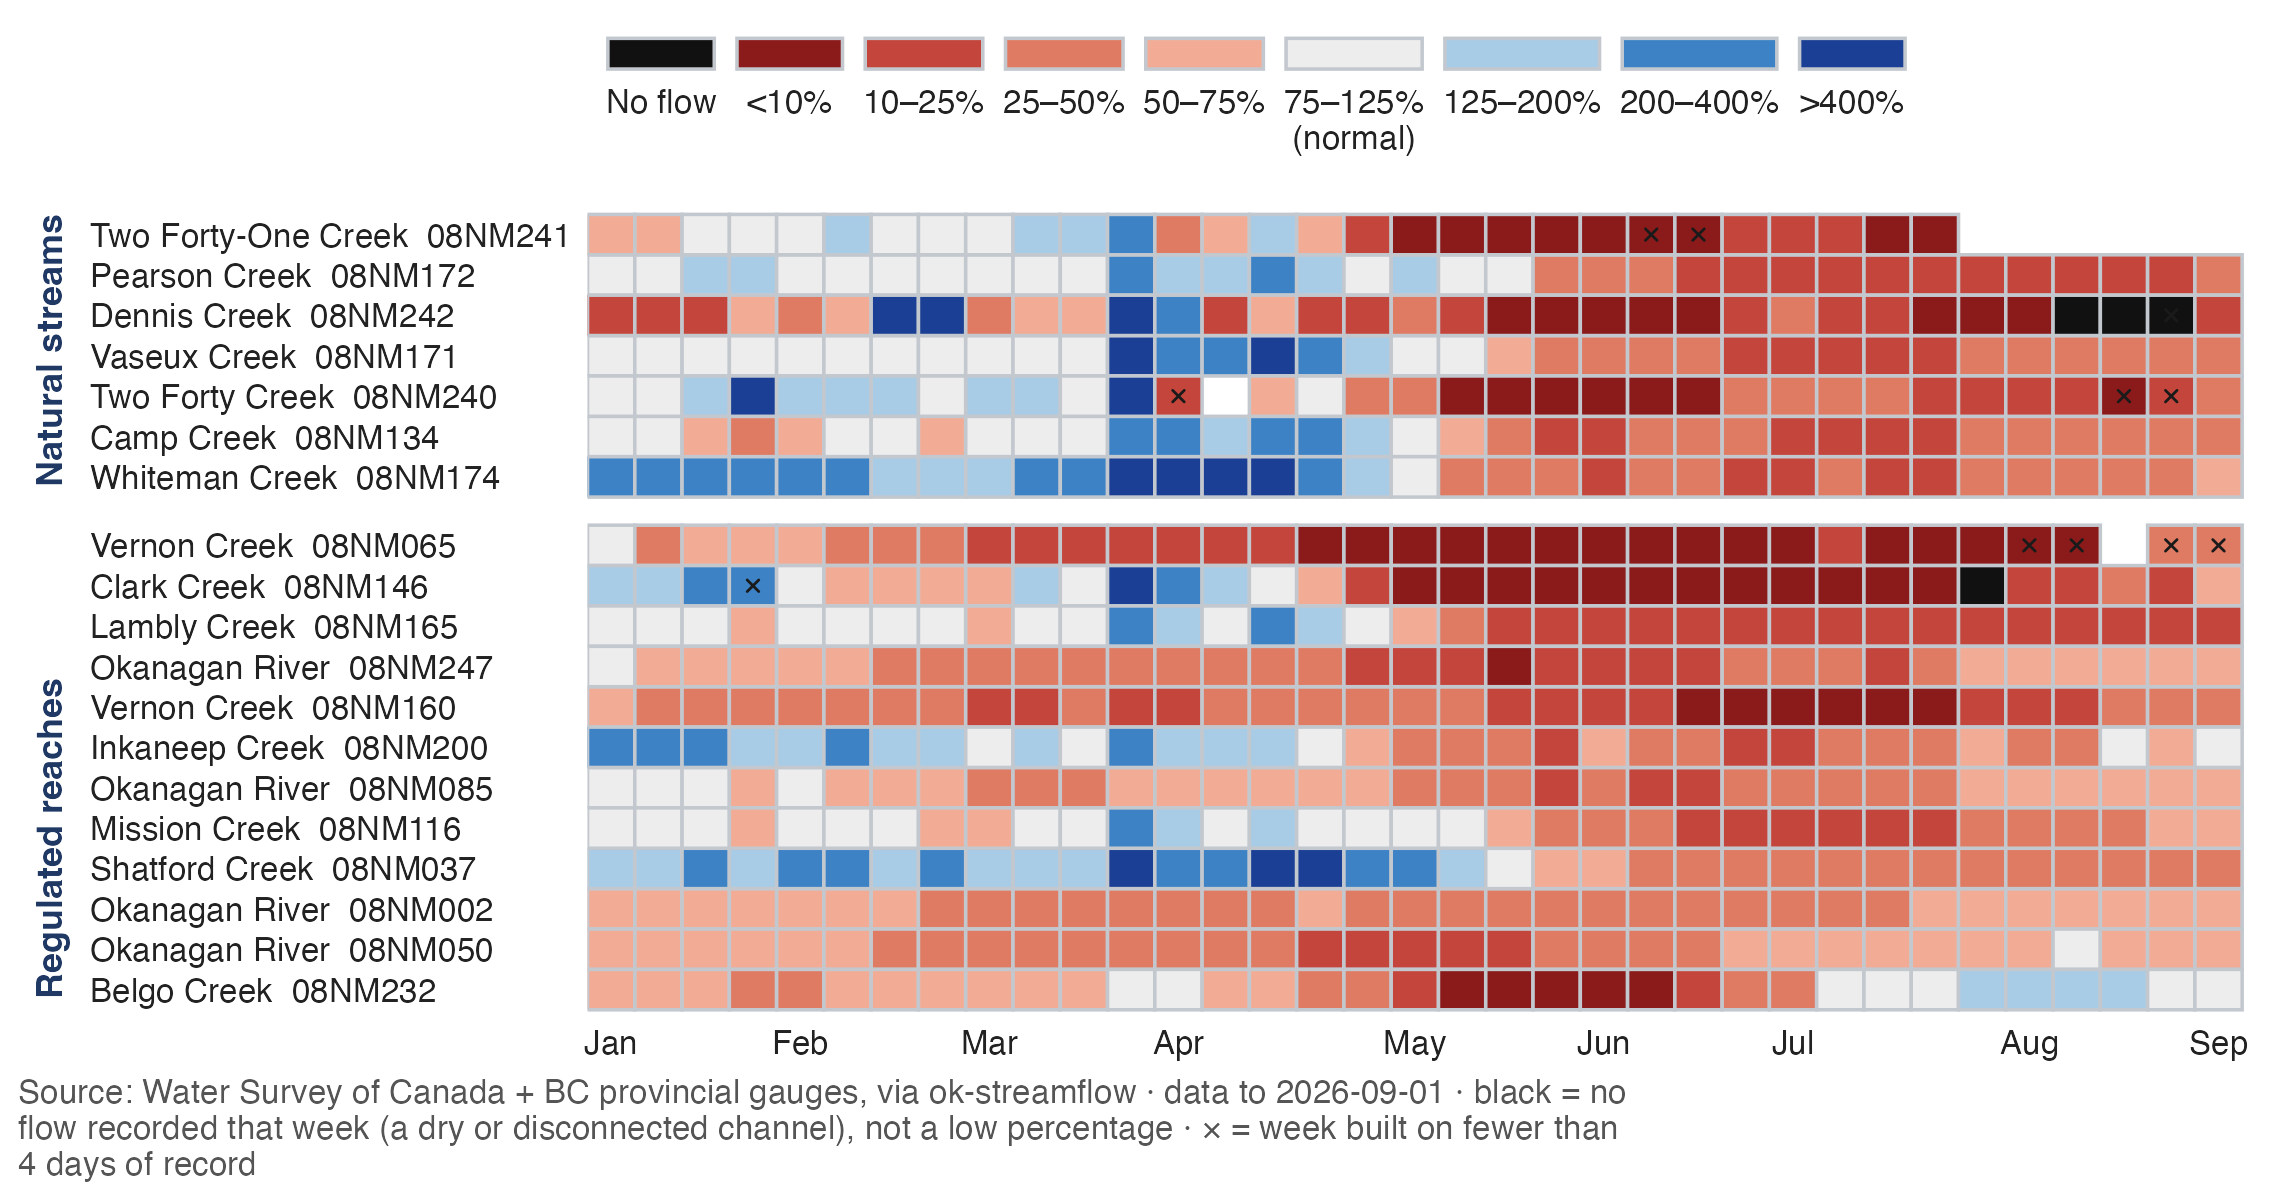
Updated 2026-09-01 · 3 days agoStreamflow conditions continue to reflect severe hydrologic stress across the Okanagan. Many monitored streams transitioned from near- or above-normal conditions earlier in the year to below-normal flows during late spring, with flows remaining depressed through July and August. By late summer, numerous natural streams were within the lowest historical percentile ranges, while many regulated reaches were also substantially below normal. The persistence and geographic extent of these low flows are particularly important because they reduce available aquatic habitat, increase sensitivity to elevated water temperatures, and narrow the margin available to balance environmental flow needs with domestic and agricultural water demands.
Stream temperatures
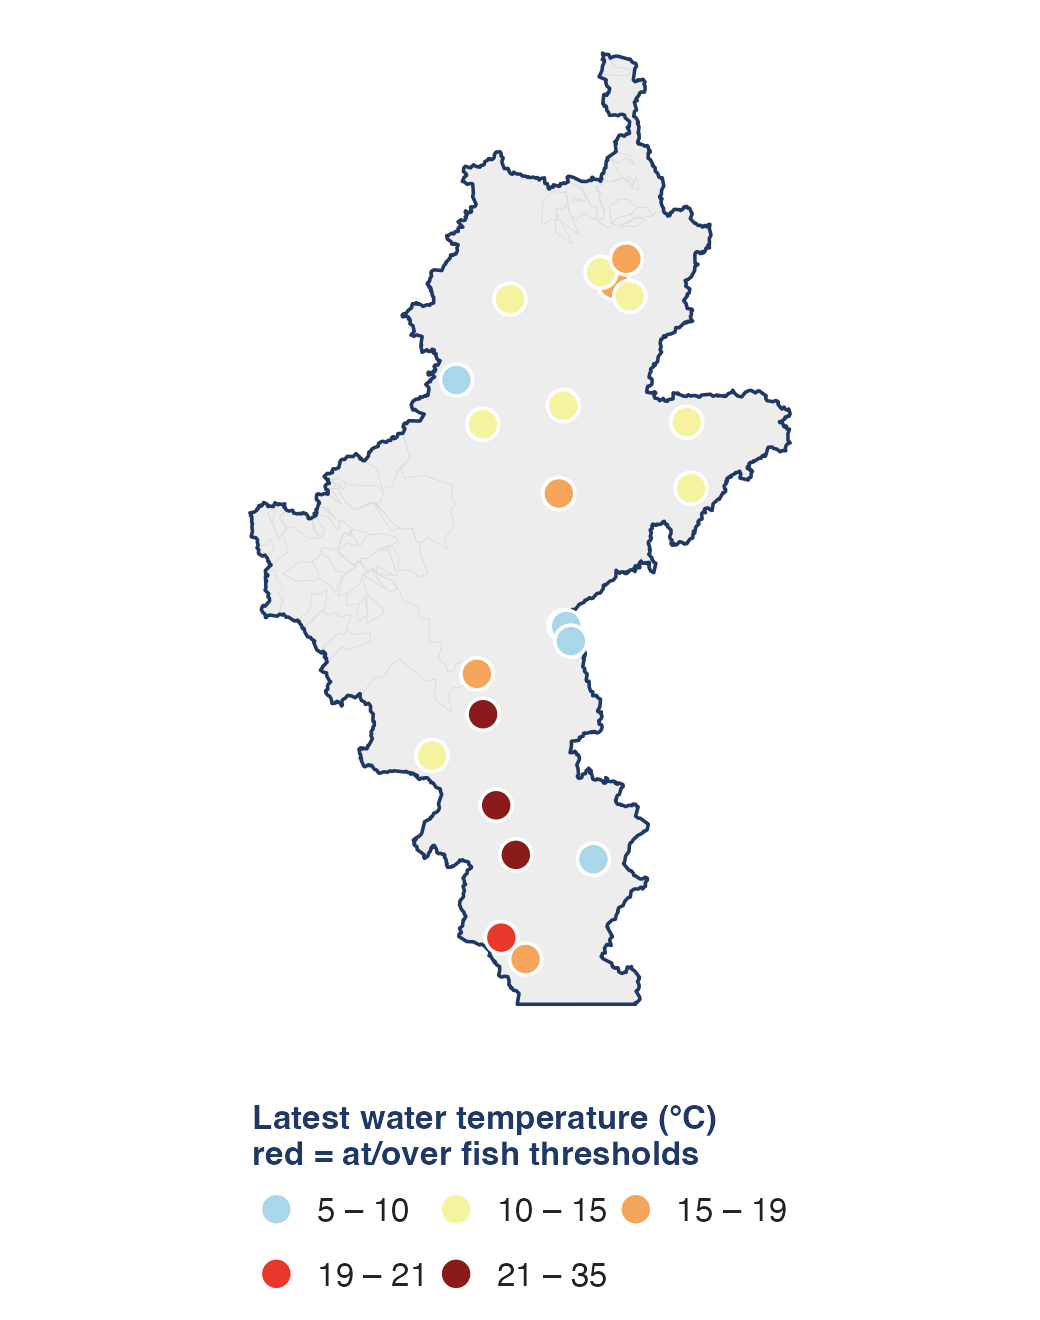
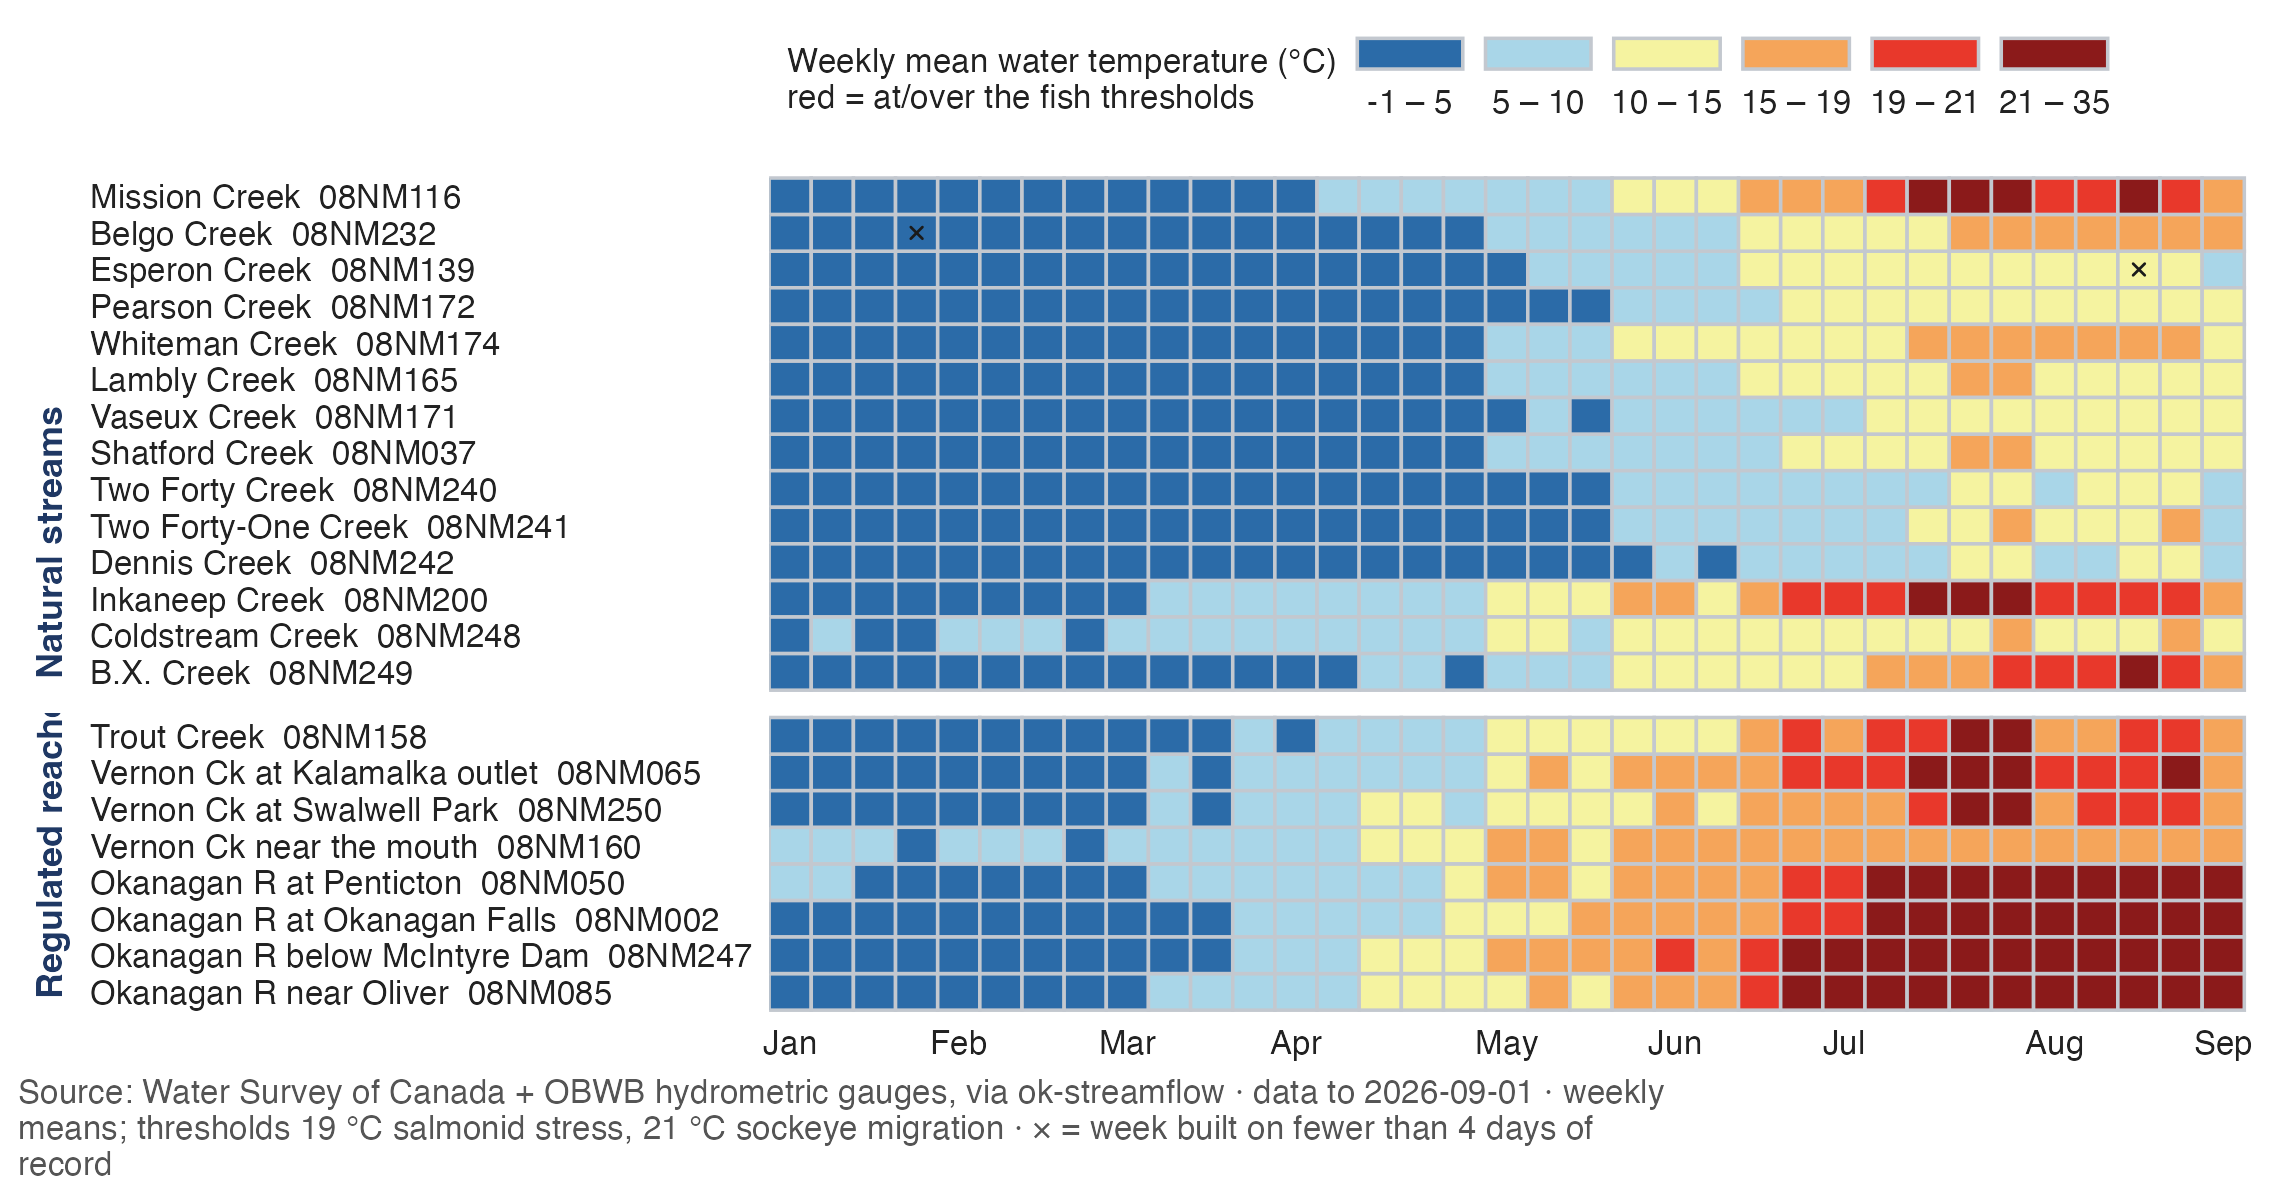
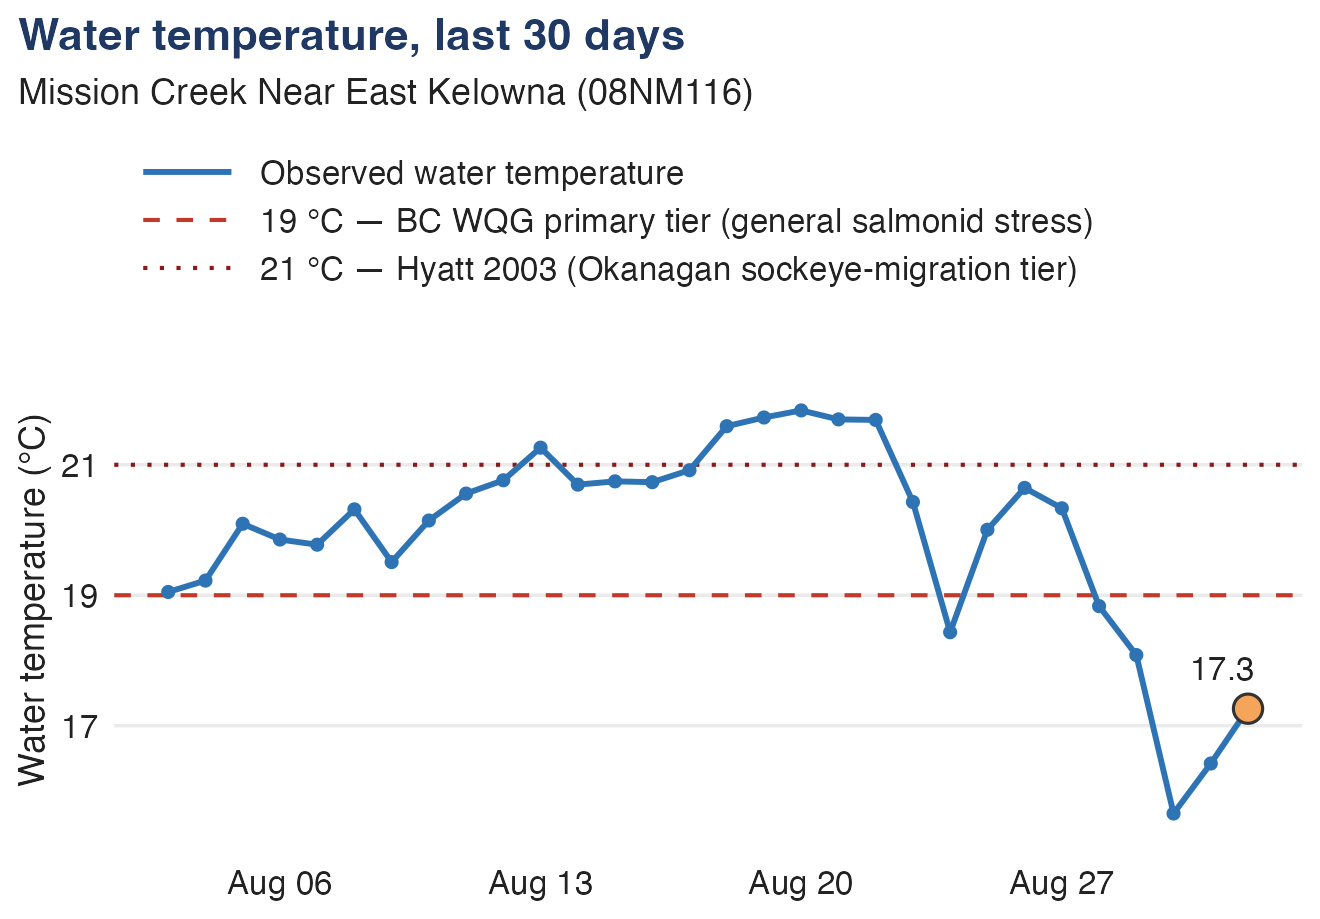
Updated 2026-09-01 · 3 days agoStream temperatures were elevated through much of August, compounding the effects of low flows. At Mission Creek near East Kelowna, water temperatures were above the 19°C general salmonid-stress threshold for much of the month and exceeded the 21°C Okanagan sockeye migration threshold for several days during the warmest period. Temperatures declined sharply toward the end of August, with the most recent observation shown in the report at 17.3°C, providing some short-term relief from acute thermal stress. The cooler conditions are beneficial; however, continued low streamflows mean that aquatic systems remain vulnerable should another period of sustained warm weather occur.
Net inflow to Okanagan Lake
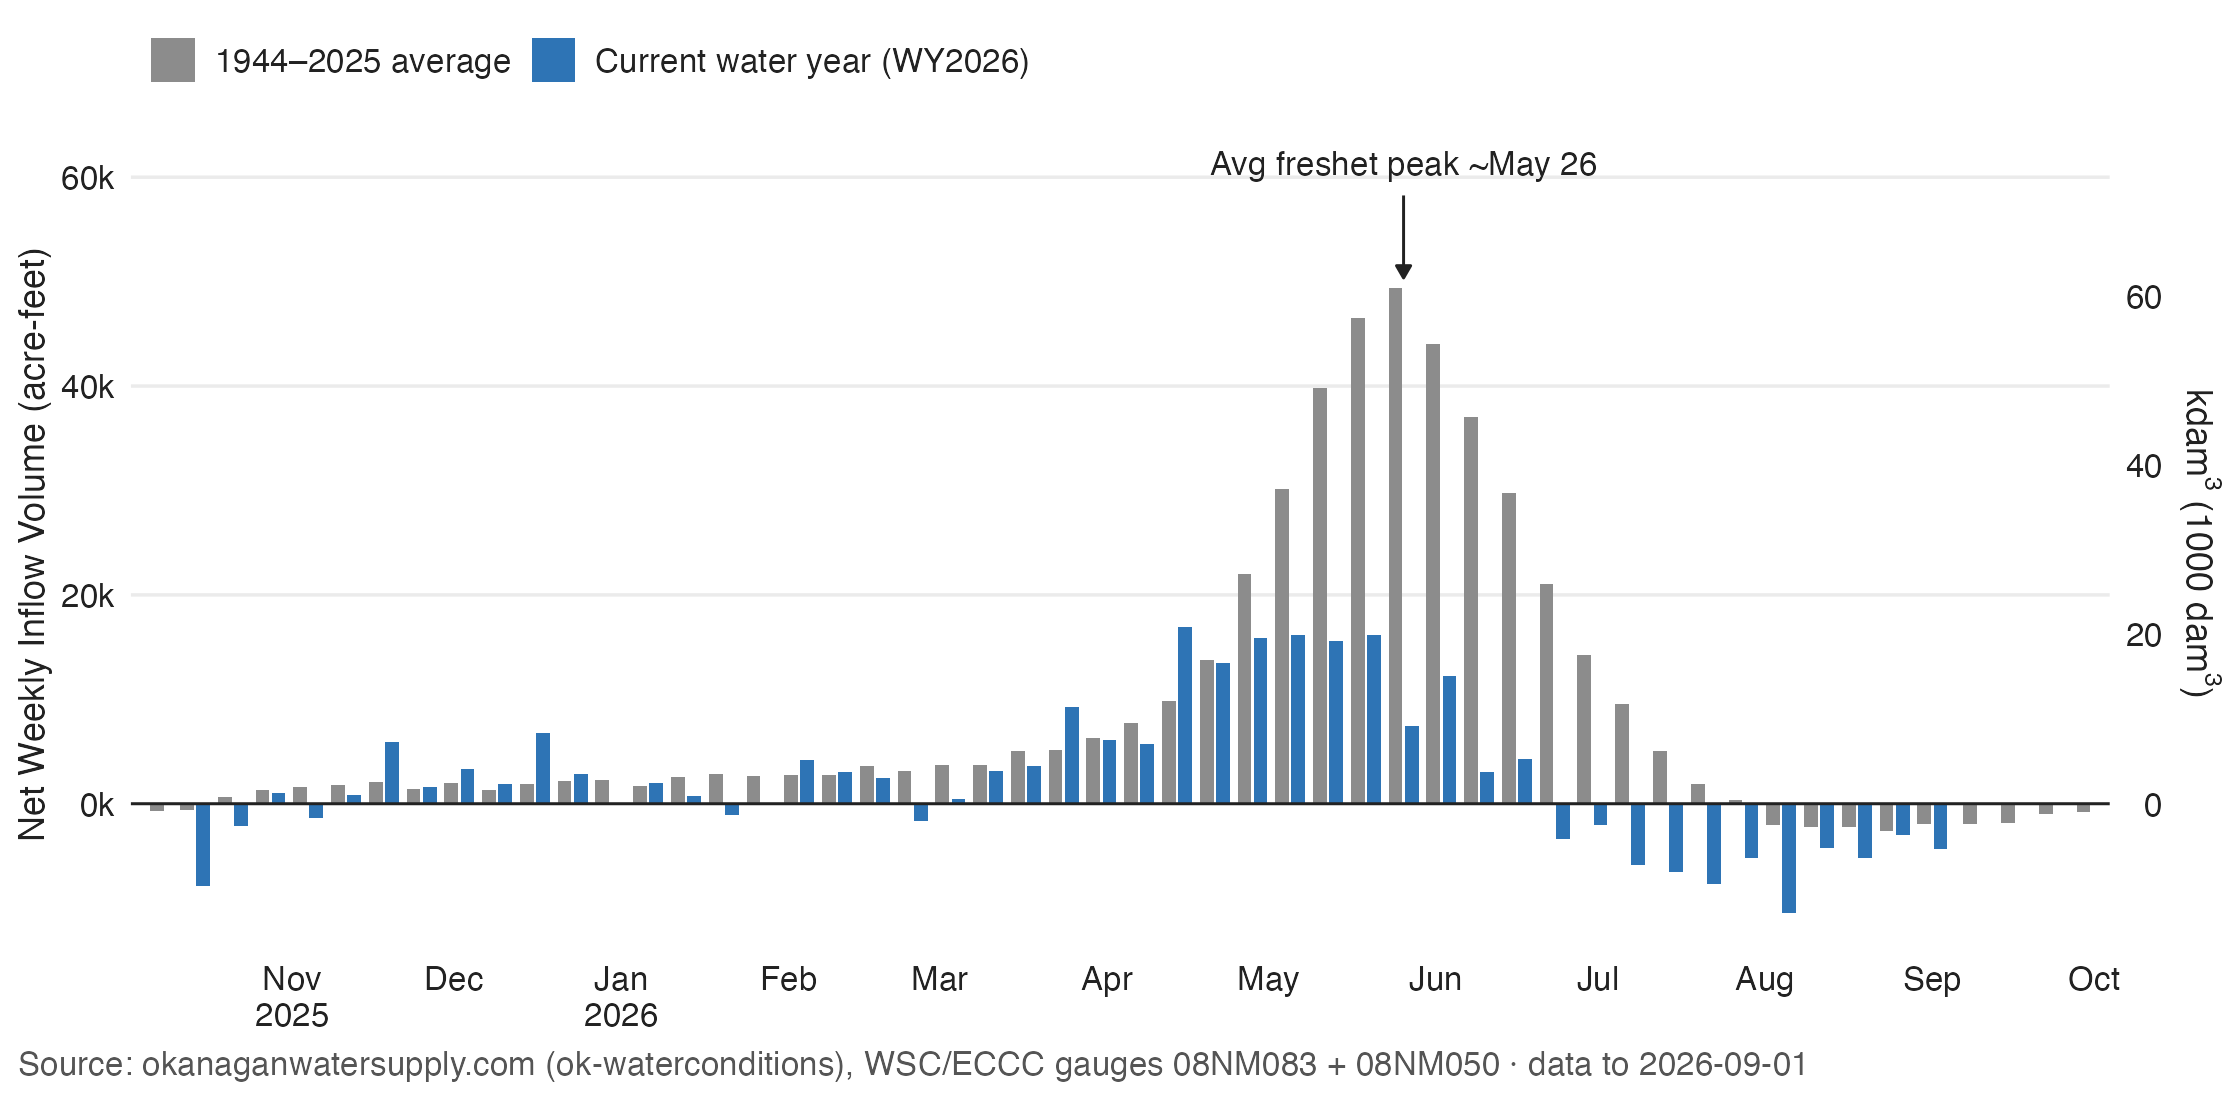
Updated 2026-09-01 · 3 days agoNet inflow provides one of the clearest indications of the magnitude of the 2026 water-supply deficit. The spring freshet was less than half of normal, peaking and ending very early. Weekly net inflow during the late-May period reached only roughly 15,000–17,000 acre-feet, compared with an average freshet peak approaching 50,000 acre-feet per week. Net inflows turned negative and the lake level started dropping by the end of June. In an average year, net inflows turn negative in August. The magnitude of lake drawdown was significantly greater than average.
Lake levels
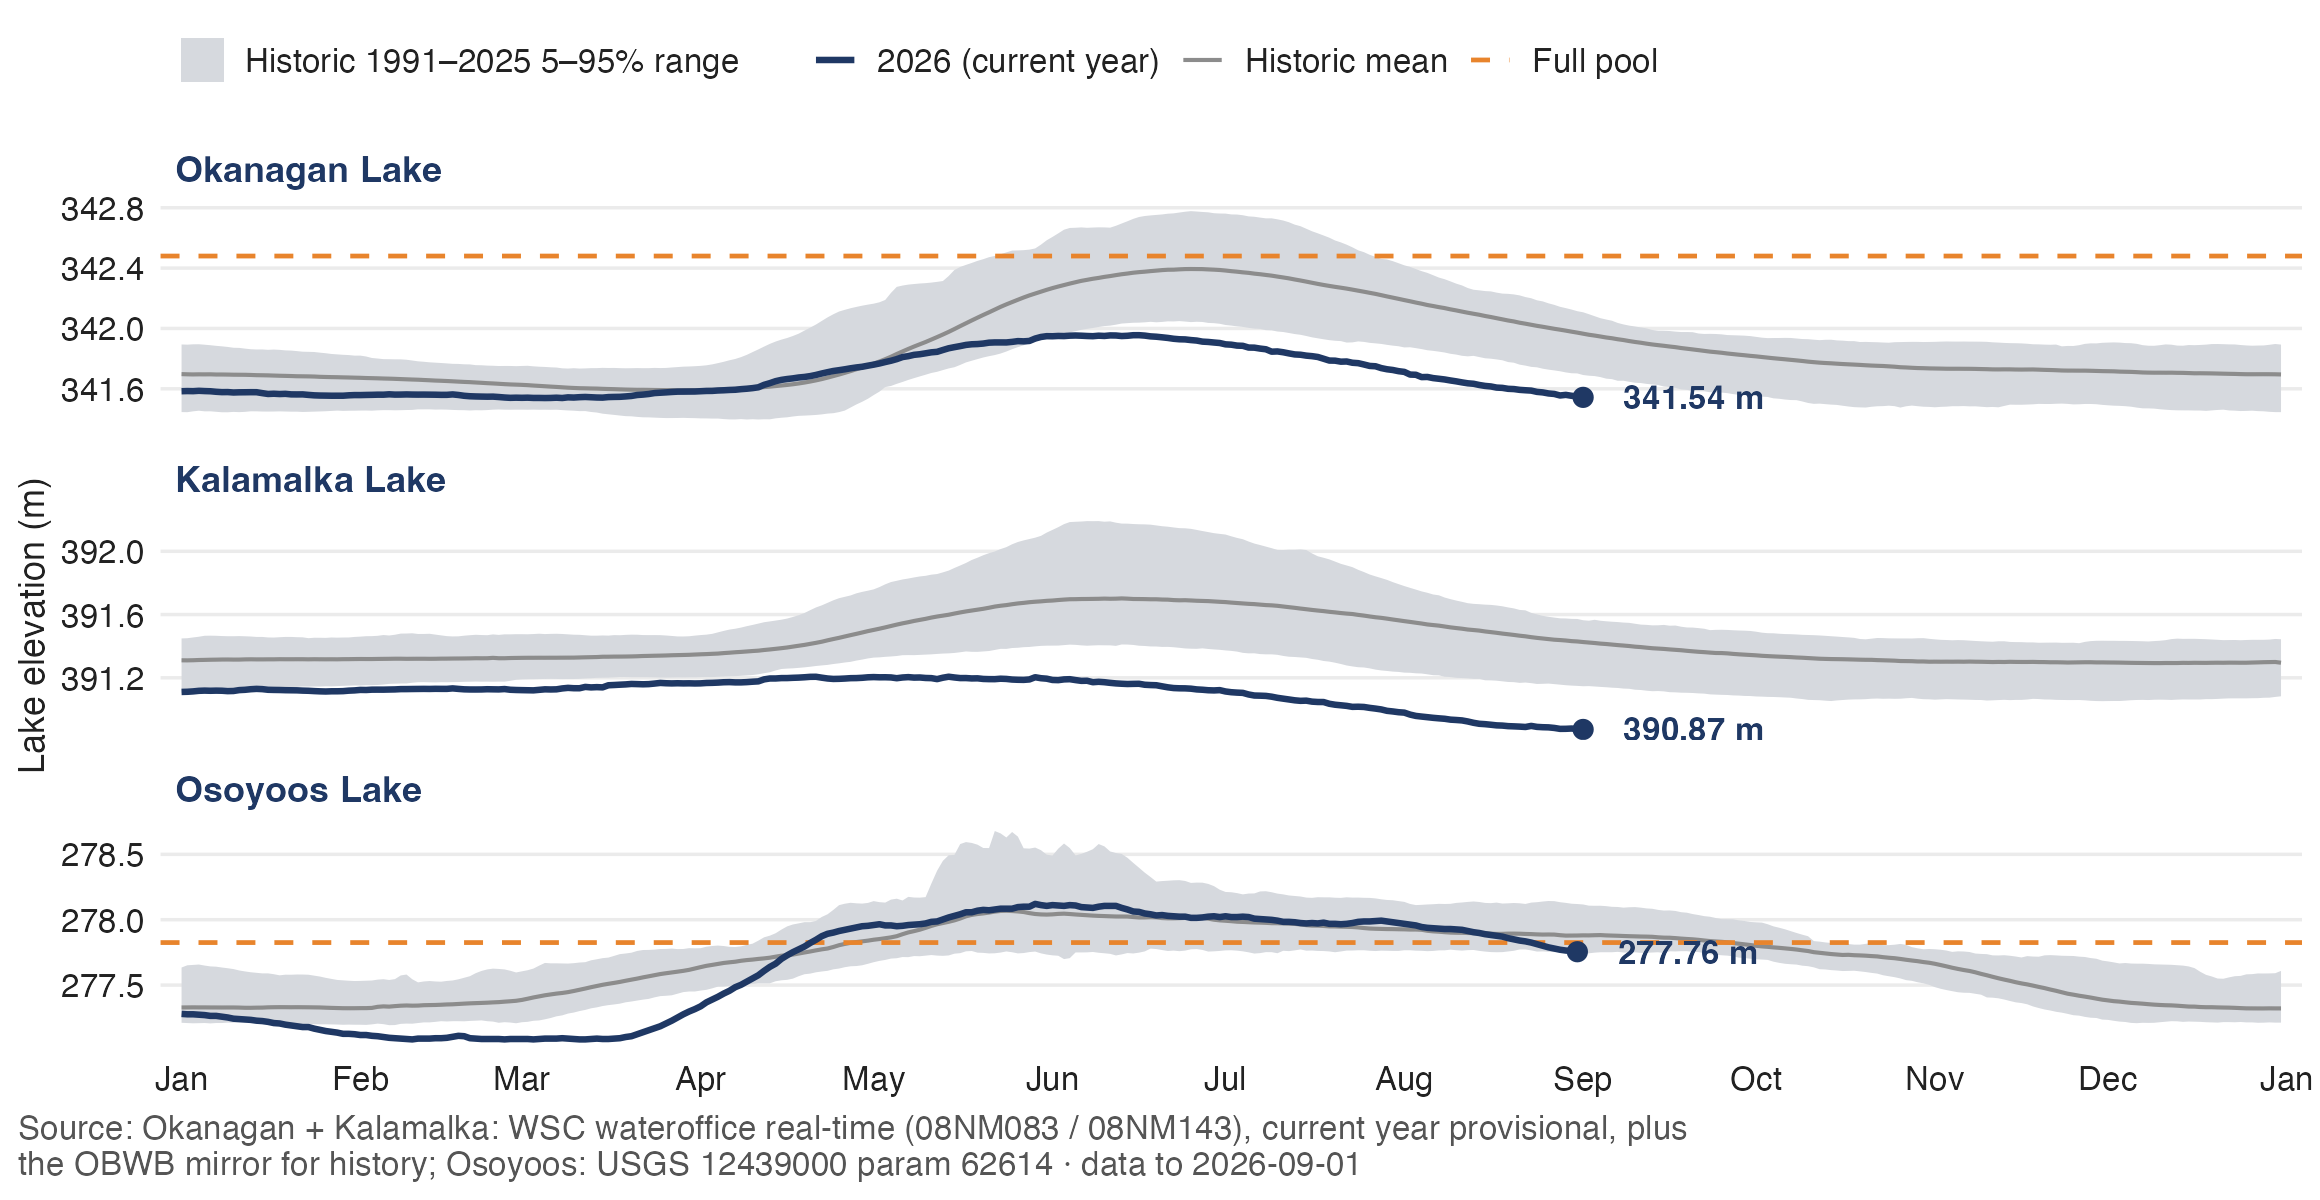
Updated 2026-09-01 · 3 days agoMainstem lake levels remain extremely low for this time of year. As of Sept. 1, 2026, Okanagan Lake was approximately 341.54 m, Kalamalka Lake 390.87 m and Osoyoos Lake 277.76 m. Kalamalka Lake is at the lowest level recorded since the installation of the control structures — so low that water is no longer able to flow into Vernon Creek, a condition known as ‘dead pooling’. Okanagan Lake is at a historic low for this time of year. The low levels in Okanagan and Kalamalka lakes reflect both the limited water carried into the system by the 2026 freshet and continued summer losses, leaving less stored water available entering the fall and winter recharge period.
Groundwater
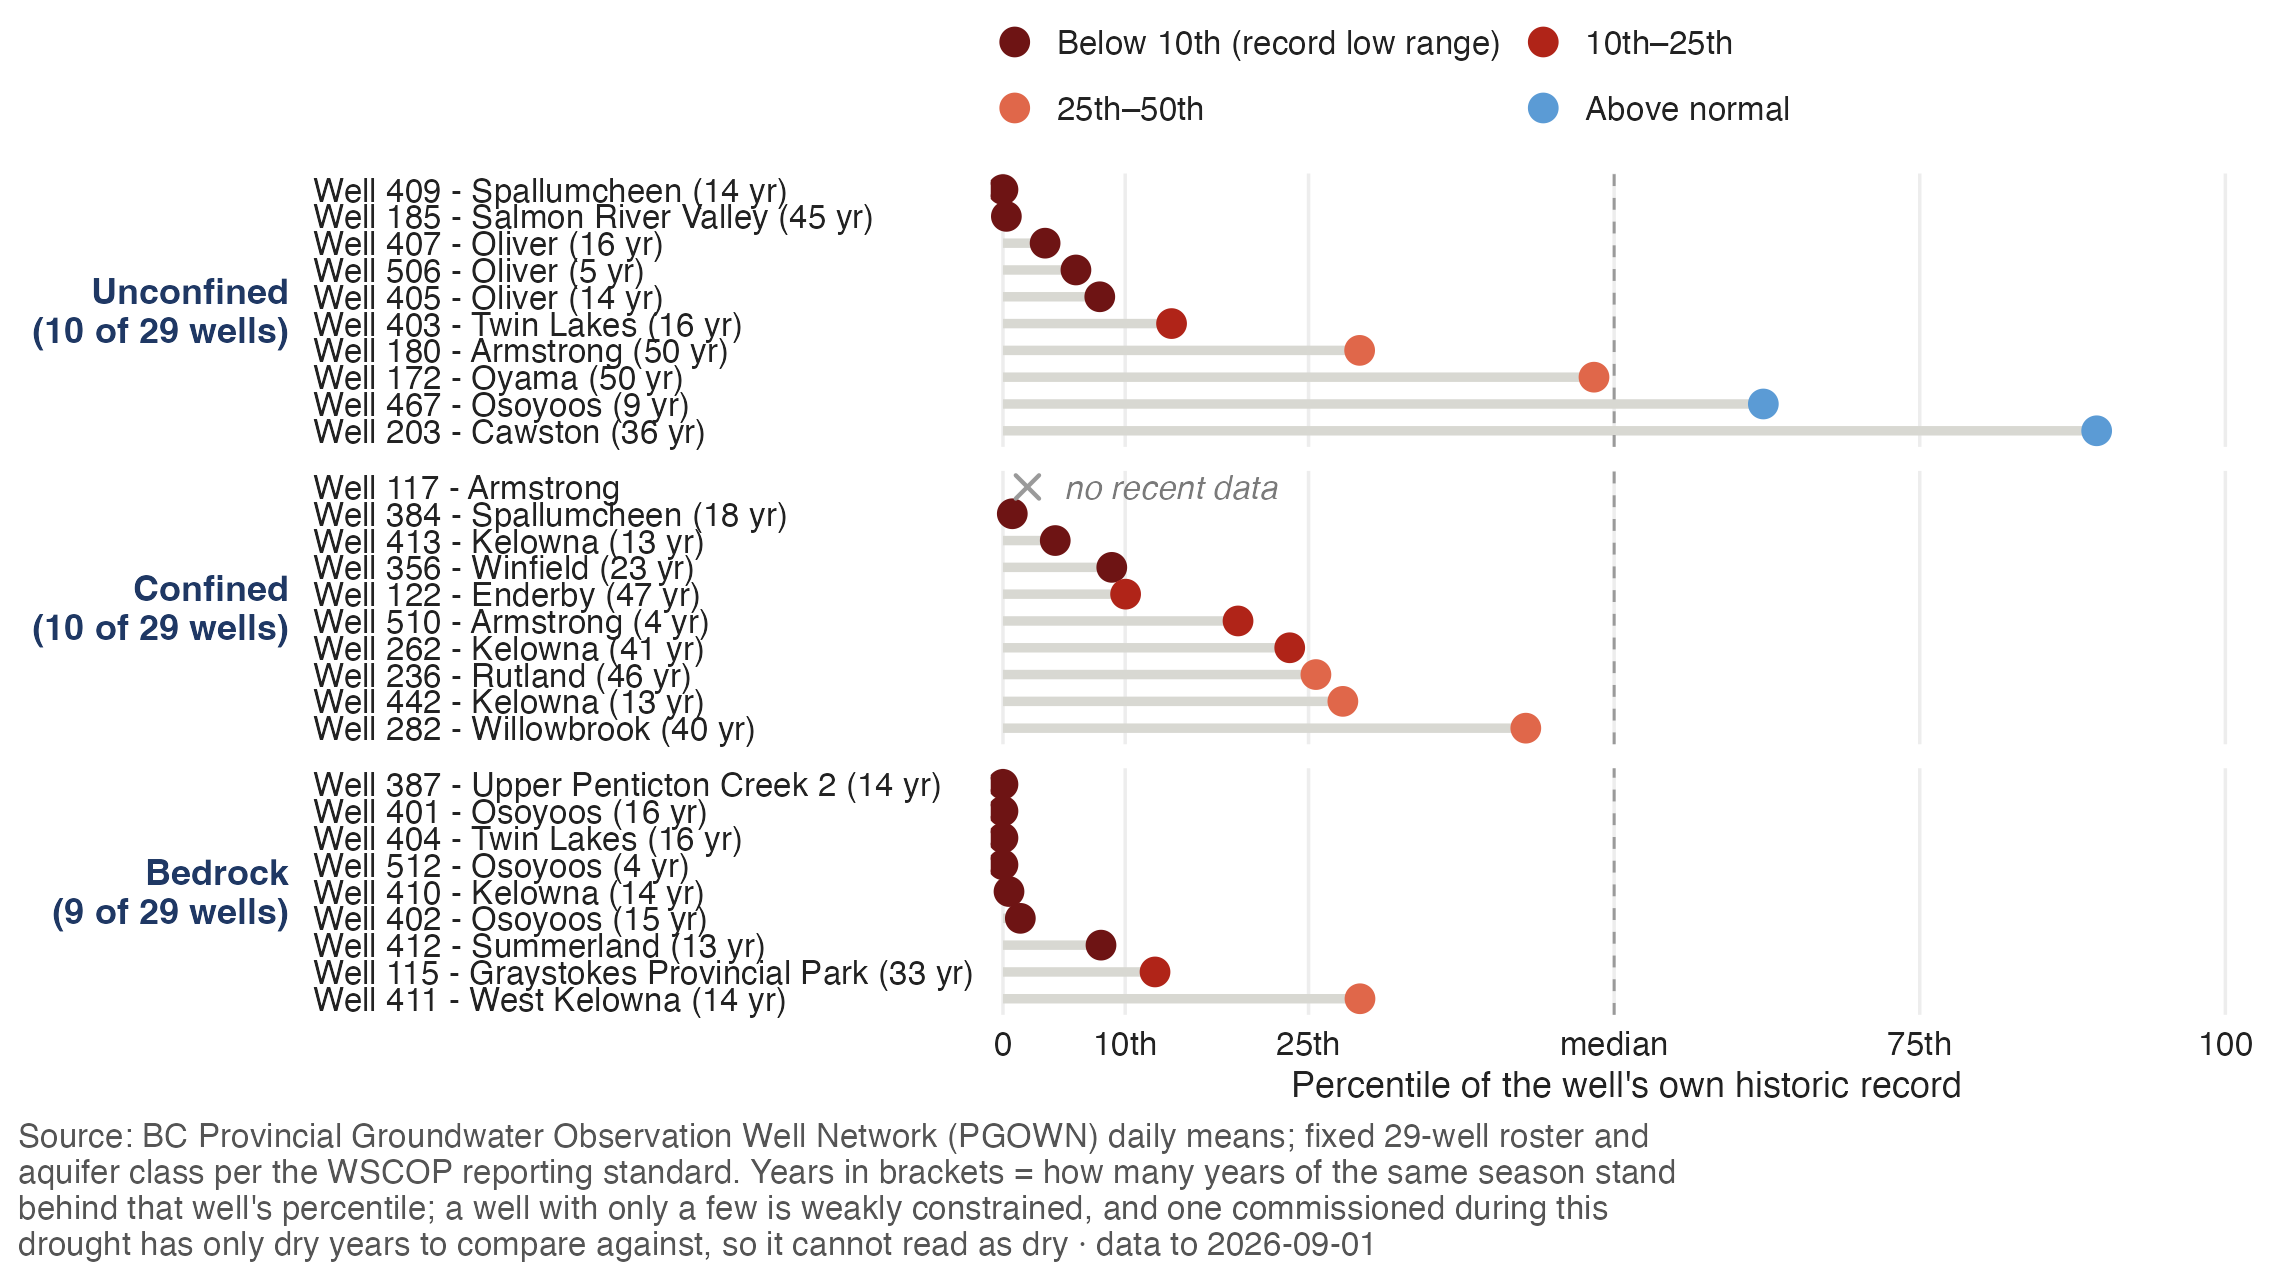
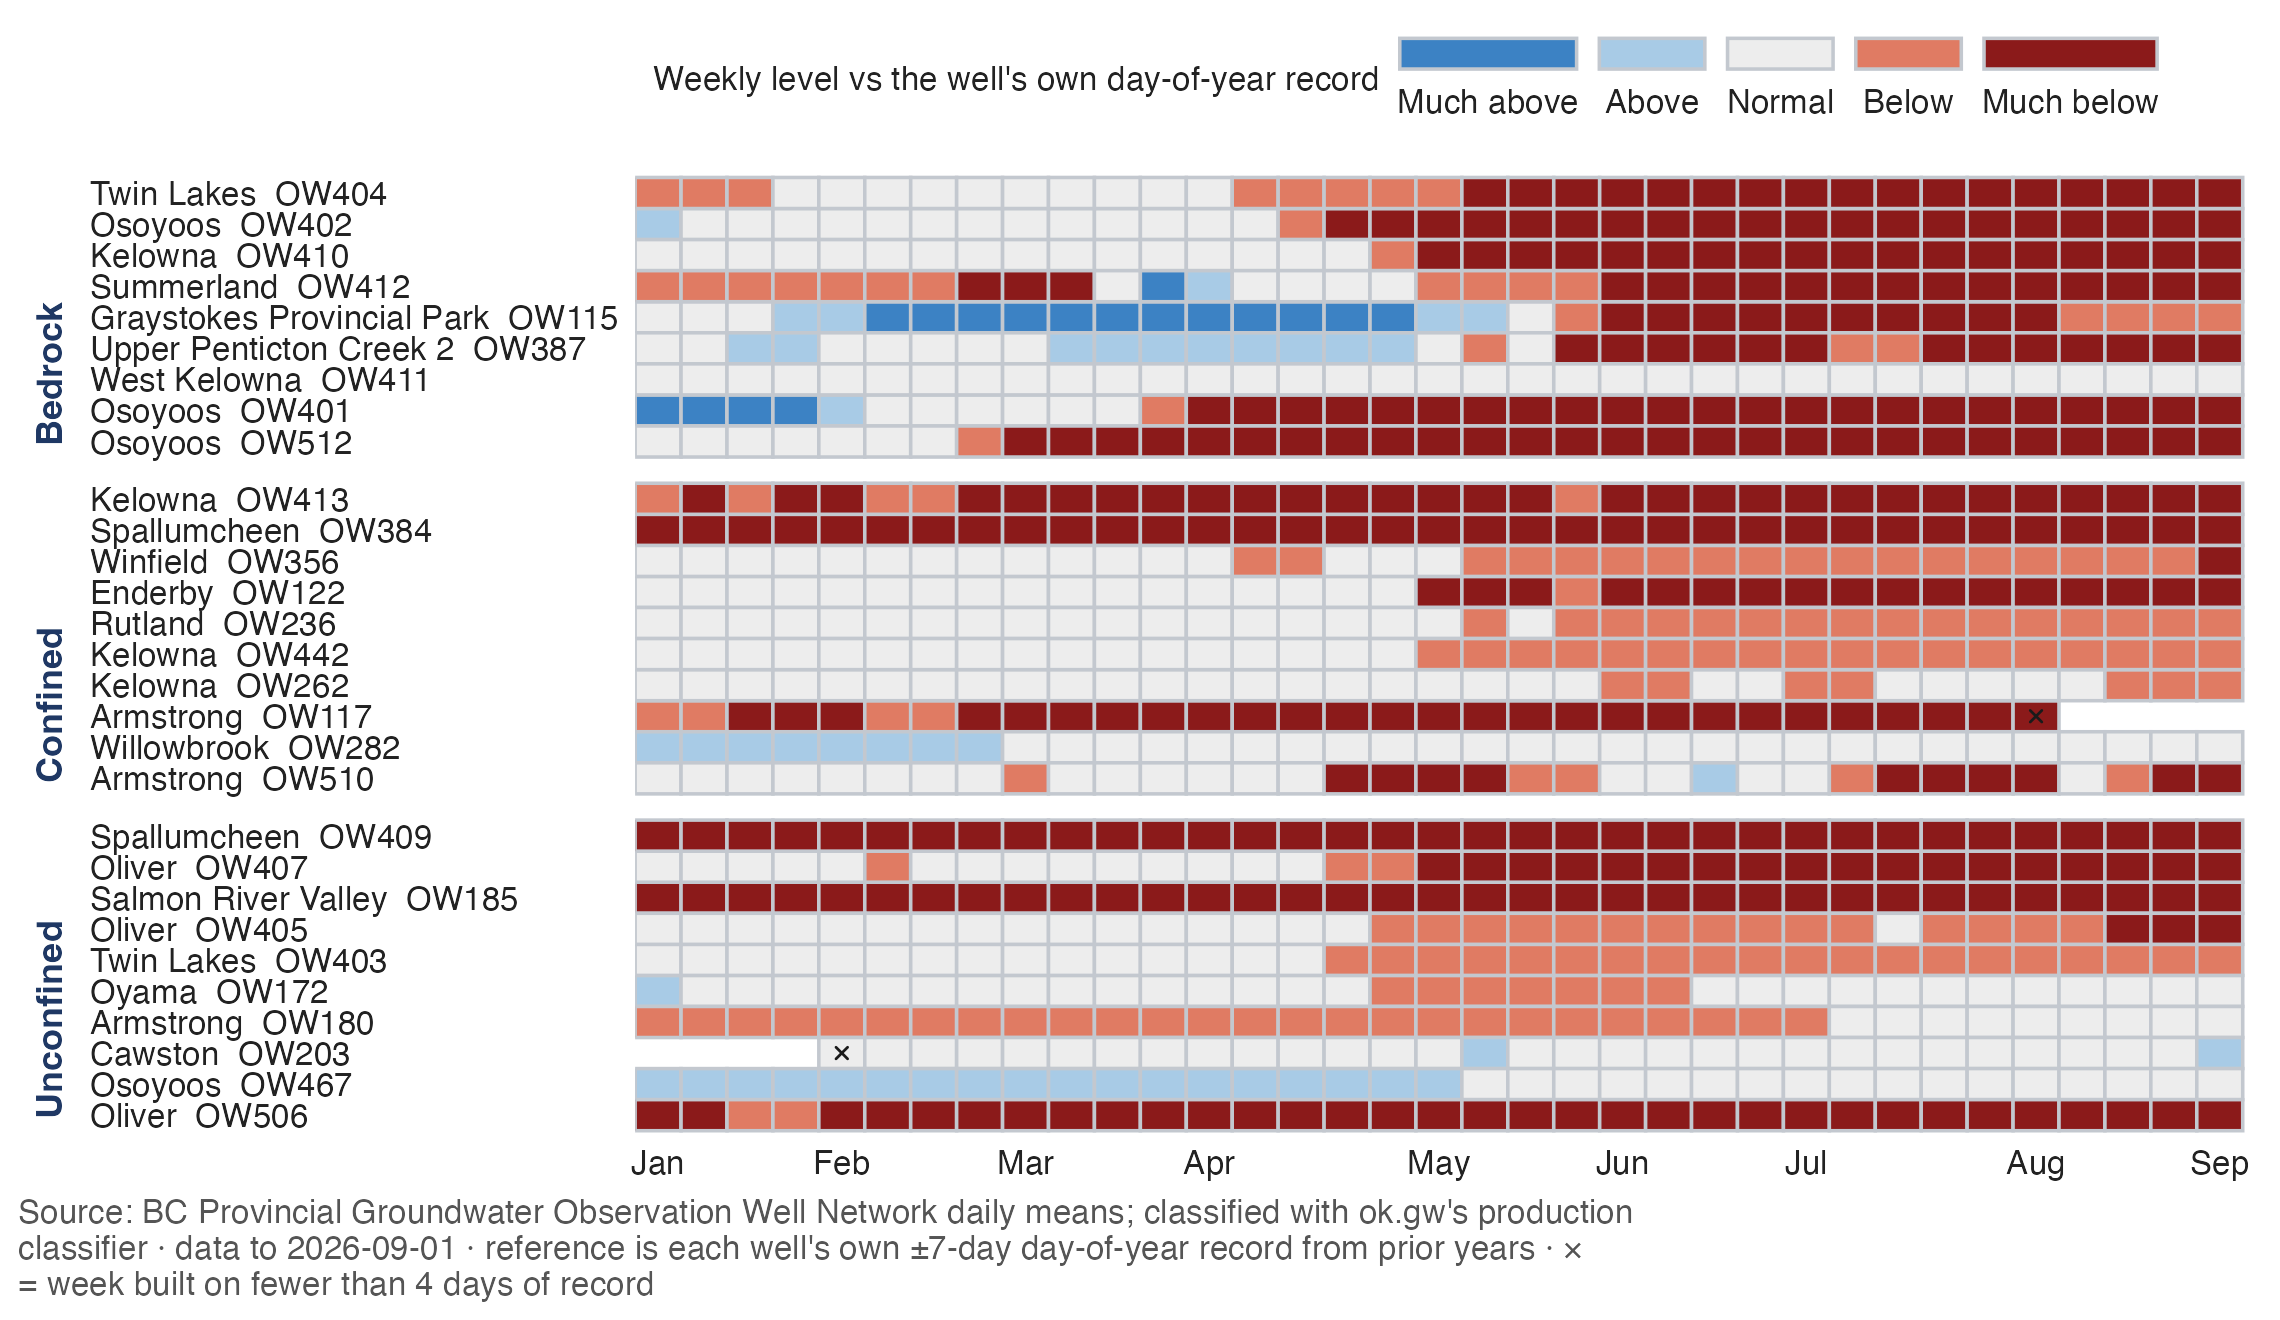
Updated 2026-09-01 · 3 days agoGroundwater monitoring indicates widespread stress across the region. Most of the observation wells shown in the report are below their historical median for this time of year, with numerous wells in unconfined, confined and bedrock aquifers falling within the lowest historical percentile ranges. Bedrock wells are particularly notable, with most observations concentrated near or below the 10th percentile, while only a small number of monitored wells, primarily in unconfined aquifers, remain near or above normal. The broad distribution of low groundwater levels indicates that drought impacts are not limited to surface-water systems and may also affect groundwater-dependent water supplies and groundwater contributions to stream baseflow.
Groundwater, week by week
Updated 2026-09-01 · 3 days ago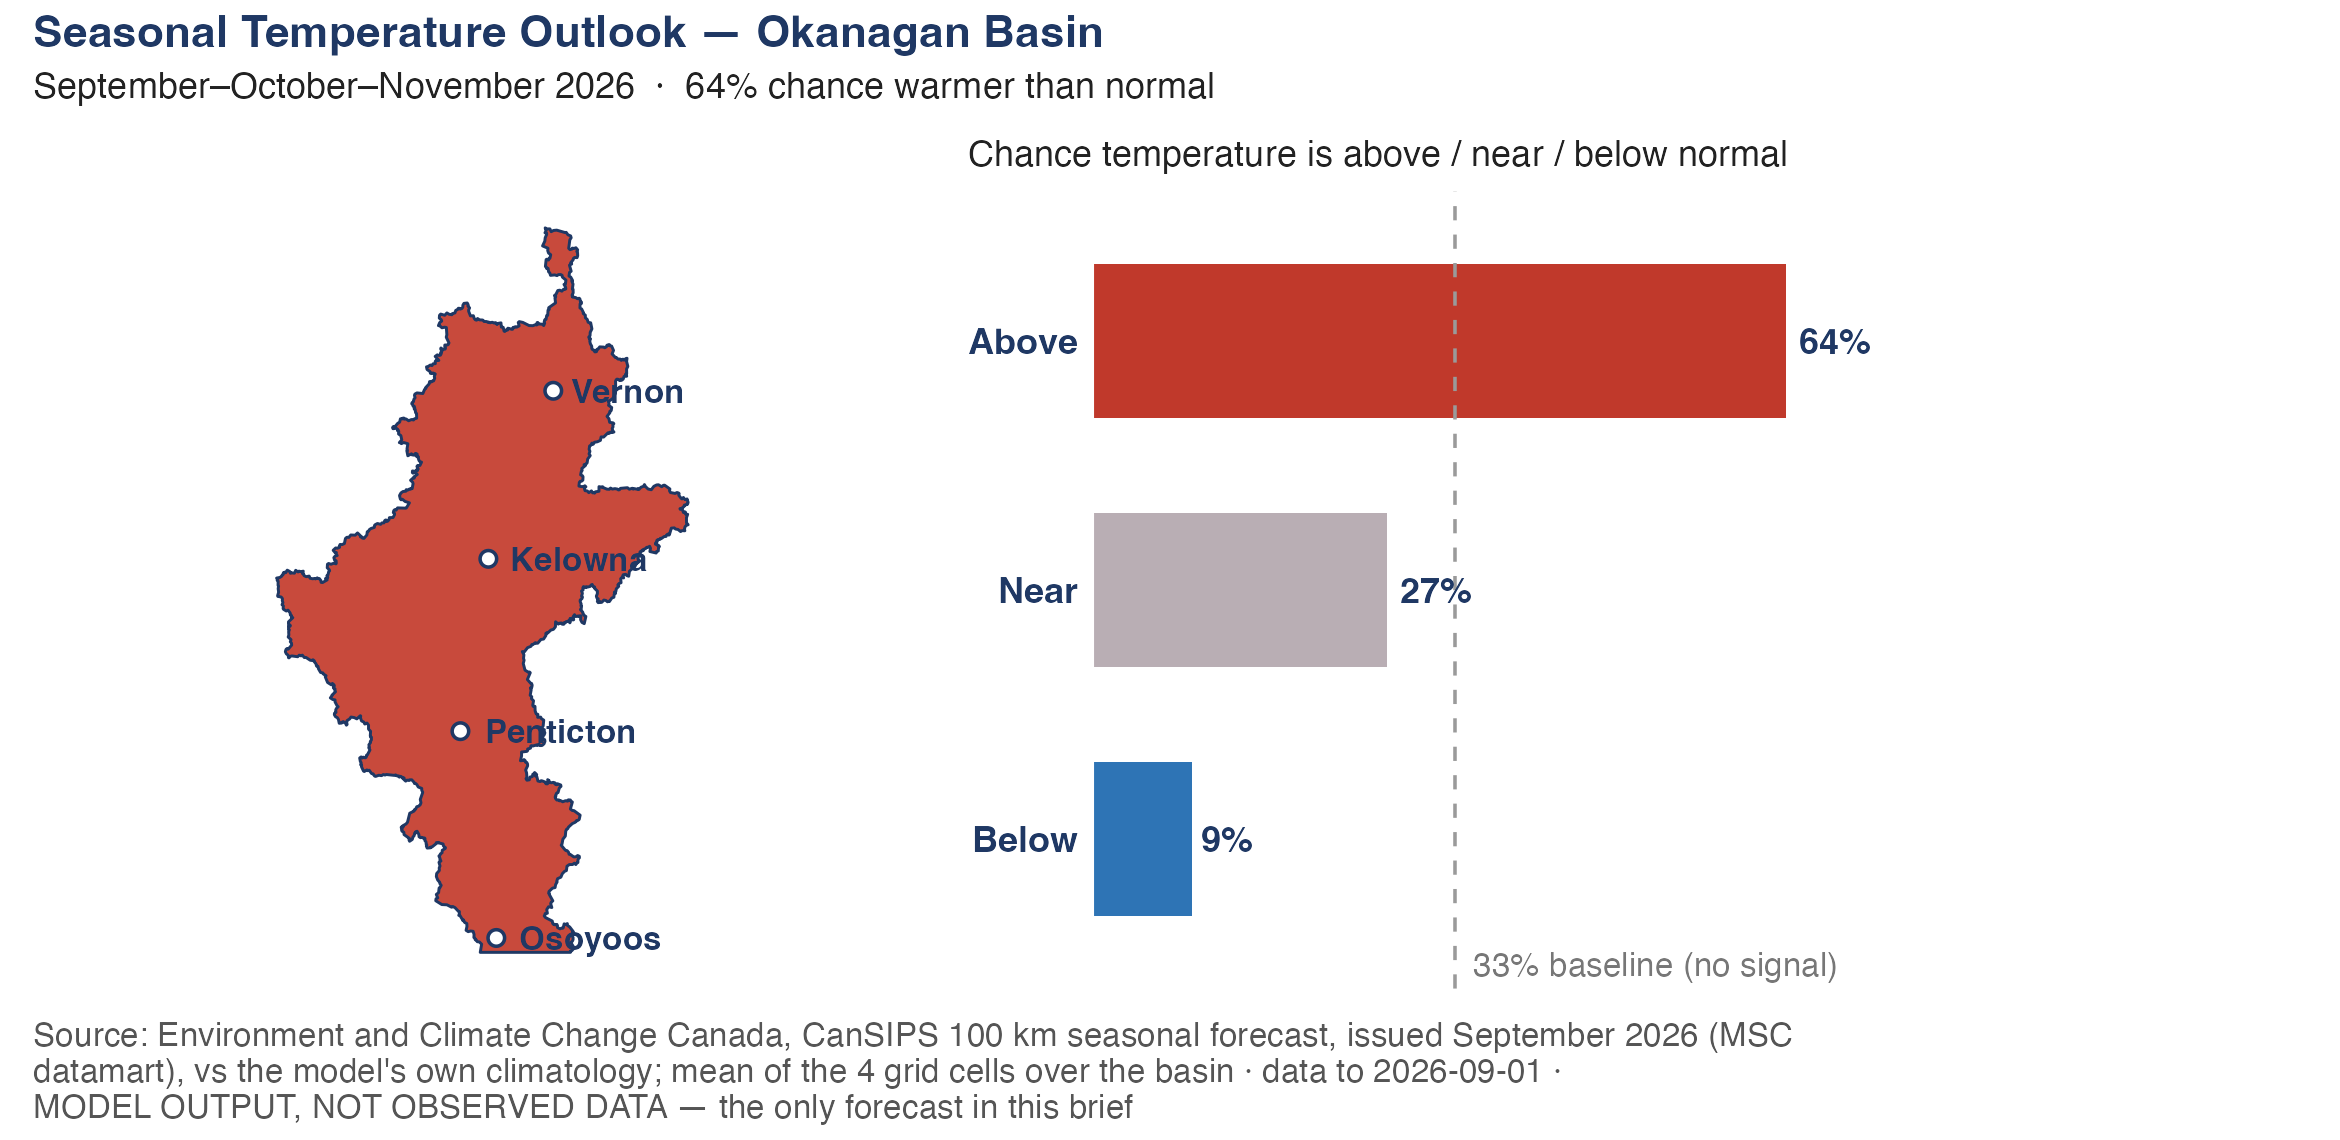
Seasonal forecast
Updated 2026-09-01 · 3 days agoThe seasonal temperature outlook does not indicate significant relief from drought pressure. Environment and Climate Change Canada’s September–October–November outlook shows a 64% probability of above-normal temperatures for the Okanagan, compared with a 27% probability of near-normal and only a 9% probability of below-normal temperatures. Warmer fall temperatures can prolong evapotranspiration and outdoor water demand and may delay the seasonal reduction in water losses normally associated with cooler autumn conditions. Substantial and sustained precipitation would therefore be required to materially improve the basin’s hydrologic position heading into winter.